
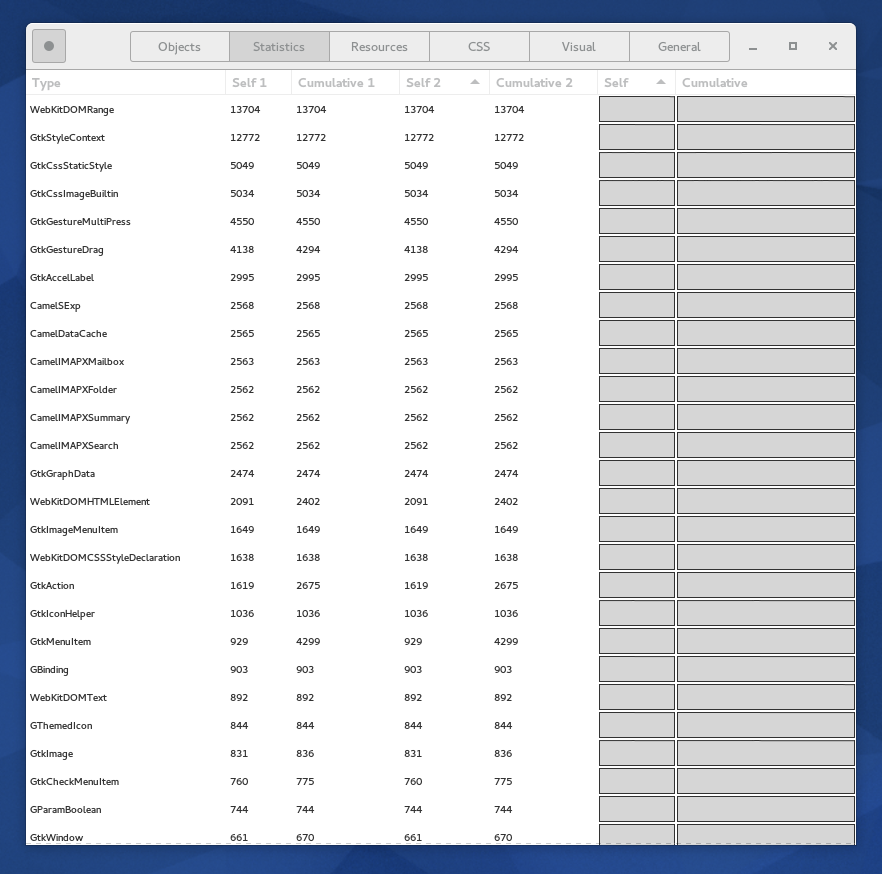
Evolution 3.12 used to take a week or two to reach 8 or 9 GiB of
memory usage, at which point I'd have to kill it and start a new one.

Evolution 3.16 seems to manage to reach 10GiB overnight, and needs to
be killed every morning to bring my machine out of swap death.

I don't really know where all the memory is going. Running with
GOBJECT_DEBUG=instance-count doesn't really show a smoking gun; it
looks something like http://david.woodhou.se/evo-statistics.png
(sorry, don't know how to get a text version of that).

The count of WebKitDOMRange objects only ever seems to go up, so I
suspect those are still leaking despite some other WebKit leak fixes
recently. But surely that can't be all there is?

I've tried using valgrind (--tool=massif) to see where the memory
allocations are. But I get wildly inconsistent results.

If I run with the default options, it doesn't seem to admit that much
memory was allocated at all. It's been running a few hours, it's using
11.1GiB (which is admittedly inflated by massif itself), but it only
*admits* to under 100MiB:

--------------------------------------------------------------------------------
  n        time(i)         total(B)   useful-heap(B) extra-heap(B)    stacks(B)
--------------------------------------------------------------------------------
 33  2,954,848,107       89,532,360       77,000,592    12,531,768            0
 34  3,087,325,256       97,270,104       82,569,293    14,700,811            0
84.89% (82,569,293B) (heap allocation functions) malloc/new/new[], --alloc-fns, etc.

(http://david.woodhou.se/massif.out.9492)

If I add --pages-as-heap=true, that makes it ignore the normal
"allocation" functions and just look at the pages which are mapped by
mmap(). Which screws the statistics for normal allocations somewhat,
because the *first* allocation in a new page gets 'credited' with
taking the whole 4KiB, while malloc() calls which get other addresses
in that same page don't show up at all. But this way, it *does* admit
that gigabytes of memory are being allocated...

--------------------------------------------------------------------------------
  n        time(i)         total(B)   useful-heap(B) extra-heap(B)    stacks(B)
--------------------------------------------------------------------------------
 43 5,840,961,313,097   10,555,485,320   10,555,485,320             0            0
 44 5,946,777,533,186   10,488,375,240   10,488,375,240             0            0
 45 6,094,323,581,406   10,563,886,472   10,563,886,472             0            0
 46 6,288,117,422,939   10,685,658,696   10,685,658,696             0            0
 47 6,477,882,772,357   10,855,649,728   10,855,649,728             0            0
100.00% (10,855,649,728B) (page allocation syscalls) mmap/mremap/brk, --alloc-fns, etc.
->91.15% (9,894,895,616B) 0x38412FC3B9: mmap (syscall-template.S:81)

(http://david.woodhou.se/massif.out.1884)

In this case, I do see some interesting additional results, like the
fact that WebKit is apparently allocating 1GiB of memory at startup:

| ->09.98% (1,081,118,720B) 0x3829E16FA1: WTF::OSAllocator::reserveUncommitted(unsigned long,
WTF::OSAllocator::Usage, bool, bool, bool) (OSAllocatorPosix.cpp:46)
| | ->09.91% (1,073,750,016B) 0x3829B72416: JSC::ExecutableAllocator::initializeAllocator()
(PageReservation.h:113)
| | | ->09.91% (1,073,750,016B) 0x3829CC66B0: void
std::__once_call_impl<std::_Bind_simple<JSC::initializeThreading()::{lambda()
| | |   ->09.91% (1,073,750,016B) 0x3841A0DACD: __pthread_once_slow (pthread_once.c:114)
| | |     ->09.91% (1,073,750,016B) 0x3829CC6723: JSC::initializeThreading() (gthr-default.h:699)
| | |       ->09.91% (1,073,750,016B) 0x382BA67BD0: webkitInit (webkitglobals.cpp:540)
| | |         ->09.91% (1,073,750,016B) 0x382BA67DC7: webkit_get_default_session (webkitglobals.cpp:86)
| | |           ->09.91% (1,073,750,016B) 0x382E412D49: shell_initable_init (e-shell.c:1396)
| | |             ->09.91% (1,073,750,016B) 0x3F8D260078: g_initable_new_valist (ginitable.c:228)
| | |               ->09.91% (1,073,750,016B) 0x3F8D260134: g_initable_new (ginitable.c:146)
| | |                 ->09.91% (1,073,750,016B) 0x40418F: main (main.c:388)

WTF indeed. But on further investigation I think that's only
allocating the address space, and not really causing it to be backed
with real pages until it's used.

But most of the other results with --pages-as-heap=yes look like
they're through the normal allocation functions and *should* have
showed up with --pages-as-heap=no. So why didn't they?

One possible explanation is that we are *massively* inefficient with
our allocations (in glibc), and we manage to allocate one tiny object
per page to the point where 100MiB of allocations actually get spread
across 8GiB of pages. But surely that's unlikely?

Is there a decent way to reliably track *all* memory usage within a
GNOME application? Am I doing something wrong?

Hm, I note that I'm up to 90000 WebKitDOMRange objects now I've almost
finished typing this...

-- dwmw2
Attachment:
smime.p7s
Description: S/MIME cryptographic signature